![]() Manual (additional information) (PDF 132KB)
Manual (additional information) (PDF 132KB)
![]() User’s Handbook (PDF File 1.43MB)
User’s Handbook (PDF File 1.43MB)
![]() Tuning fork vibro method as a Japan industrial standard
Tuning fork vibro method as a Japan industrial standard
(News flash: July 2011 / PDF 93KB)


Features
External Input / Output
RS-232C interface
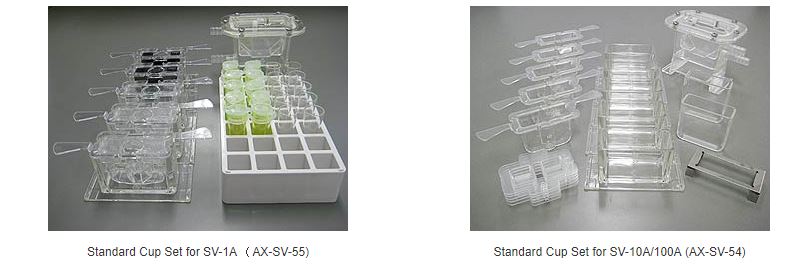
Accessories
Click here to see the complete accessory list.
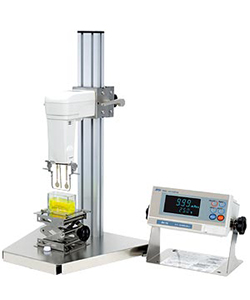
Example Measurements with the Tuning Fork Vibro Viscometer (SV/SV-A Series)
The SV-10/SV-10A series of tuning fork vibro viscometers are capable of continuous measurement over a range of viscosities from the extremely low (0.3 mPa·s) to the high (10,000 mPa·s).
These viscometers are able to easily measure the state transition from sol to gel as there is no need to change sensors during measurement.
Measurement intervals can be set freely allowing for continuous 24-hour measurement or measurement of any long term viscosity change.
Example) Gelatin, agar, glucomannan, thickening stabilizer, hydrogel
Example) Paraffin, non-ionic surfactants
Example) Cement, butter, milk, cream, asphalt, ink, paint, gold nanocolloids
Example) Engine oil, grease, mineral oil, synthetic oil, water-based lubricants, animal and plant oils
Example) Egg white/yolk, solder flux, silicone adhesive, mortar, plaster, rubber and polymer adhesives
Examples) Food related – Water, alcohol, liquors, soft drinks, soy sauce, milk, Medical related – Blood, protein, drugs, easily swallowed foods, easily digested foods Other solvents – cosmetics, semiconductor polishing agents
Example) Honey, polymer solutions, toothpaste hand creams, lipstick, chocolate
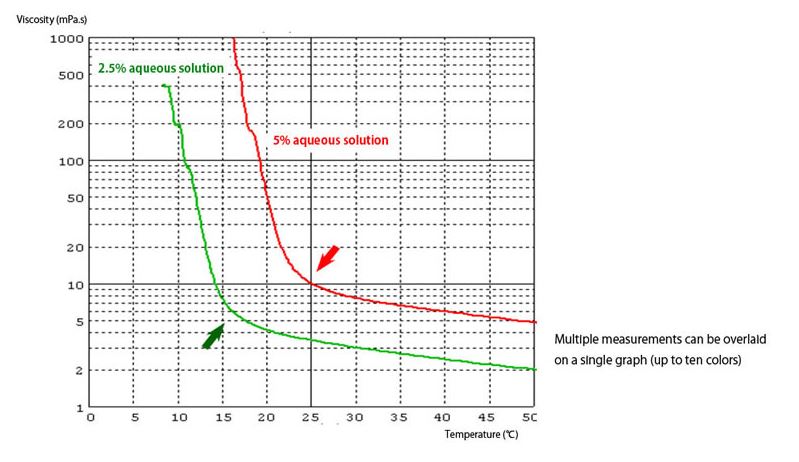
Gel transition / hydrogel measurement Example) Aqueous gelatin solution
This example shows viscosity measurement of 2.5% and 5% aqueous gelatin solutions over varying temperature.
The horizontal axis shows temperature and the vertical axis shows a logarithm of the viscosity of the aqueous gelatin solutions. There is a clear difference in solidification temperature which is dependent on the concentrations of the aqueous gelatin solutions.
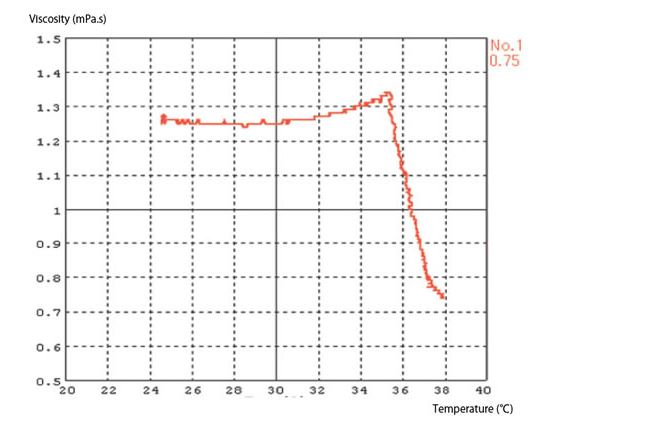
Cloud point measurement Example) Non-ionic surfactant
This is the result of a measurement taken while a 1% concentration of a non-ionic surfactant was heated. Surfactants become cloudy when they reach a certain temperature. This is called the cloud point and traditionally could only be measured optically.
However, a rapid change in viscosity occurs at the cloud point and this change can be measured with the SV-10A.
From this graph of temperature vs. viscosity we can see that a rapid change in viscosity occurs at 35.4˚C. This temperature is taken as the cloud point. This non-ionic surfactant is defined to have a cloud point at 35.9˚C according to JIS standards, demonstrating that the SV-10A is capable of cloud point measurement.
Rapid Rise in Viscosity (Measurement of the curing point) Example) Egg whites
As egg whites are heated to 60˚C their viscosity will decrease like normal liquids. However, once 60˚ is reached viscosity will increase suddenly, as the proteins in the egg whites clump together.
The SV-A series of vibro viscometers can accurately capture small changes specific to a certain substance as well as dynamic changes in viscosity.
As shown in the graph below made with WinCT-Viscosity (RsVisco), viscosity can be displayed as a logarithm allowing for simple, easy-to-understand graphical representation when viscosity change covers a large area or for non-linear changes.

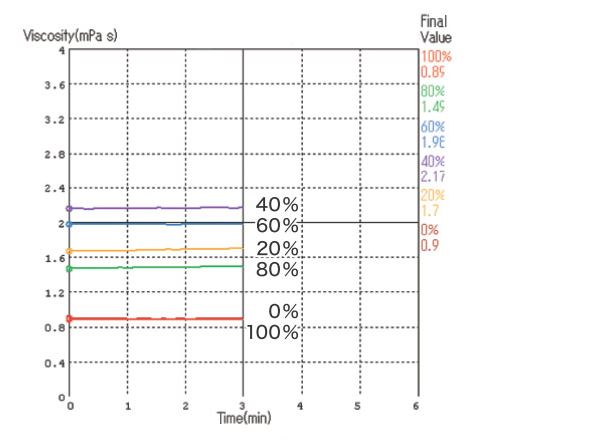
Measurements at low viscosity Example) Measuring the viscosity of varying concentrations of aqueous ethanol solutions.
The viscosity of varying concentrations of aqueous ethanol solutions at 25˚C was measured with the SV-10A. Viscosity of these solutions was shown to vary with concentration. Alone, both 100% ethanol and 100% water have low viscosities but when they are mixed viscosity increases.
WinCT-Viscosity data processing software
WinCT-Viscosity is dedicated software that makes realtime graphs of data acquired from the SV Series and SV-A Series viscometers (WinCT-Viscosity supports Windows 8). WinCT-Viscosity allows for simple reading, storage, and analysis of measurement data acquired from SV viscometers. WinCT-Viscosity is comprised of three programs.
RsVisco allows for realtime graphing of data captured from a viscometer. The changing processes of the observed viscosity and temperature can be displayed simultaneously during measurement. Graphs with differing measurement conditions can be overlaid as well.
RsCom transfers data from the viscometer to a computer. It is useful for controlling the viscometer.
RsKey is used to transfer data taken from a viscometer to other software.
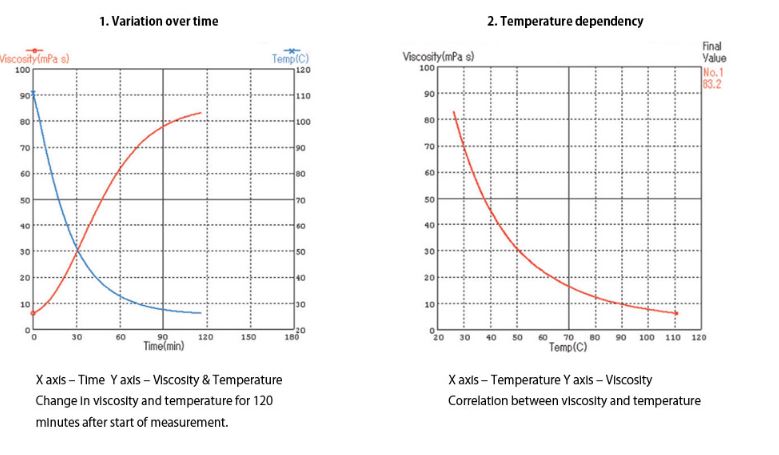
1. The time axis: Track variation over time
2. Identify temperature dependency: Find a correlation between temperature and viscosity
3. Focus on specific values: Easily select min and max values for the X/Y axes
4. Convert to Excel file: Convert a file with a CSV extension to Excel for preparing documents
Example) Engine Oil
1. Variation over time
2. Temperature dependency
Example) Thickening Agent
1. Overall numerical value change
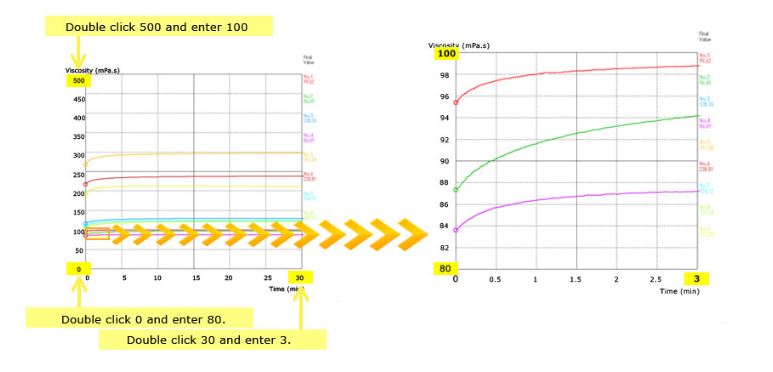
2. Using min/max to focus on specific values
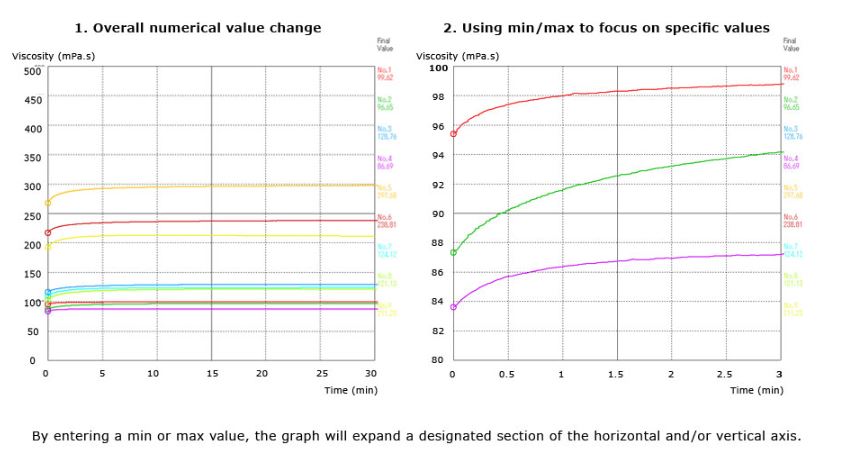
It is possible to expand a designated section of the X and Y axes. Double click to overwrite the value.
Example) Expansion of the viscosity range between 80-100mPa·s for the first three minutes of measurement.
→ Double click the maximum value (shown as 30 on the graph) of the X axis (time) and enter 3.
→ On the y axis (viscosity) double click the minimum value (shown as 0 on the graph) and change to 80, double click the maximum value (shown as 500) and change to 100.
⇒ A graph of the designated area will be displayed.
Specifications
| Model | SV-1A | SV-10A | SV-100A |
| Measurement method | Tuning fork vibro method (natural frequency at 30Hz) | ||
| Viscosity measurement unit | mPa·s, Pa·s, cP, P | Pa·s, P | |
| Viscosity measurement range | 0.3 to 1000 mPa·s | 0.3 to 10000 mPa·s | 1 to 100 Pa·s |
| Repeatability (standard deviation) | 1% of the measured value (20 to 30°C, no condensation) | ||
| Minimum sample amount | 2 ml | 10 ml | |
| Temperature measurement | 0 to 160°C / 0.1°C(32 to 320°F/0.1°F) | ||
| Display | Vacuum Fluorescent Display (VFD) | ||
| Power supply / consumption | AC adapter / approx. 14 VA (including the AC adapter) | ||
| External dimensions / weight | Main unit: 112 (W) × 132 (D) × 291(H) mm / approx. 0.8 kg | ||
| Display unit: 238 (W) × 132 (D) × 170(H) mm / approx. 1.3 kg | |||
| Standard accessories | Stand for securing the sensor unit, X-Y-Z stage, cup set Software set (including a serial-USB converter) AC adapter, connection cable (1.5 m), carrying case |
||